Telemetry-driven development: How to gain confidence in your coding agents’ behavior with gcx and Grafana MCP
Telemetry-driven development
Unless your system is brand new, it’s likely emitting telemetry, and you have some dashboards or SLOs set up to monitor its health. These existing data points can become part of the spec for your agent, to complement your written specs and test criteria.
If you’re new to observability, or you’re not sure what metrics or telemetry you want in your system, or if the work to add them seems overwhelming, take a look at gcx’s bundled
gcx-observabilityskill, which will guide you and your agent through instrumenting your codebase, and show you what other observability features you could use. Take a look at the skill withgcx agent skills get gcx-observability.
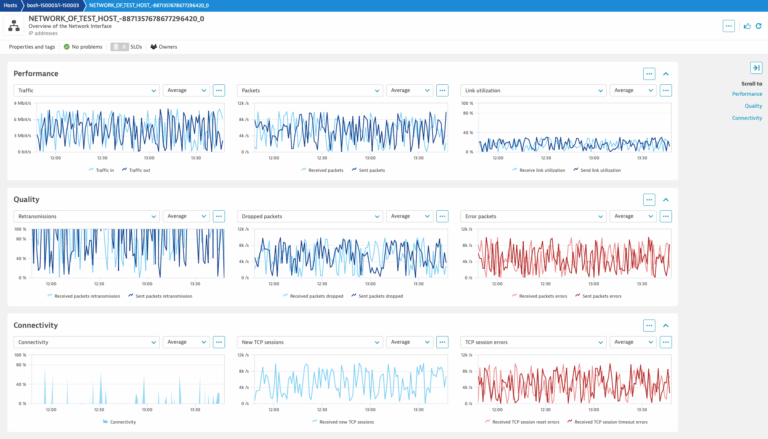
To illustrate this, let’s continue with our payment provider example, where we have an existing dashboard showing RED metrics. You need to make sure you can detect issues with the new provider, so you tell your agent to update the dashboard to sum the metrics by provider. With gcx or the Grafana MCP server, your agent can read and update these dashboards. It can also write the updated dashboard spec to source control or push it back into Grafana for you. It can even inspect the queries used in the dashboards and find the places in the codebase to update the telemetry.
To make the best use of the telemetry when you’re building, your agent also needs to iterate on the changes until the desired behavior is observed. To see the data in those metrics, it needs to export telemetry from your local build. This kind of setup task is much easier with AI: Agents have been trained on many OSS observability products and know how to run an OpenTelemetry Collector and send that data to your Grafana stack for you (See our CTO Tom Wilkie’s post Why open source is the cheat code for AI).
If you want a fully local setup instead, tell your agent to use the grafana/otel-lgtm Docker image for an out-of-the-box LGTM stack. You can configure gcx to also interact with this local Grafana instance. In our example, you could pull the payments dashboard from production with gcx resources pull and push it into your local Grafana instance. Agents (with an assist from the gcx documentation that they read along the way) can also help tweak some data source settings so you have a dashboard and metrics to validate against.
As a result, you have a fully automated feedback loop from your telemetry, which the coding agent can use to iterate on changes until it reaches your desired state.
Generate some traffic
From there, maybe you need to simulate some payment traffic to see how it behaves. This is another example of the kind of task that used to be time consuming and difficult: without AI, you’d need to understand the shape of the traffic, and either hand-write some sample requests to cover the scenarios you could think of, or use some fuzzer to put some variety into your traffic. Then you’d need to go and understand k6’s syntax for creating test scripts, and maybe also figure out how to run k6 locally. This is at least a day’s work.
Now, with AI, you can ask an agent to generate that sample traffic, write tests scripts and even stand up k6 in a Docker container for you. It can access the production telemetry to know what shape and rate of requests is most useful for you. Then, you can watch how your system behaves under some load. This gets you closer to proving the system will work in real conditions.
k6 comes with its own bundle of agent skills, which you can install with
k6 x agent init(for examplek6 x agent init claude-code, or--allto cover every supported tool). Like the rest of this workflow, these skills draw on your telemetry: they can teach your agent to author new tests from realistic traffic, work out whether a failing run was the test or the system under test, and analyze trends across runs to propose fixes or tighten thresholds before they become an issue in production.
When you can see your local builds run, and you can see that it’s behaving and performing as you expect under some realistic load, you’ll have more confidence. You can build faster and still feel in control.
Improvement loops
Agents can also suggest improvements for you. Tell an agent to reduce your system’s memory footprint by 10% and it can query profiling data, find hotspots in the code, and create a draft PR explaining what it changed. From there, you can use your k6 scripts and telemetry setup to prove the change worked.
The Tempo squad at Grafana Labs is already using a pattern like this: They have a custom agentic harness that will iteratively conduct a performance analysis on a development environment that has some significant load—typically a few terabytes of data in its bucket.
For each analysis, it performs some queries against the dev environment to get a baseline. Then it checks the profiles for the deployment to find candidates for improvements. If it finds a candidate, It implements the change, deploys it, and reruns the same query to compare to the baseline. With that data, the team can decide whether they want to commit the change.