How AI Turns Monitoring From “What Now?” Into “What’s Next?”
Every on-call engineer knows the moment. The dashboard turns red across multiple services, the PagerDuty notification fires, and the investigation begins. You can see that something is broken. Latency is spiking. Error rates are climbing. But the dashboard doesn’t tell you why. It doesn’t tell you which of the fifteen services in your delivery chain is actually responsible, or which dependency three layers deep triggered the cascade.
So you start the manual triage. Open the waterfall. Inspect each hop. Cross-reference with recent deployments. Ping the person in Slack who dealt with something similar six months ago. The gap between “we detected a problem” and “we know what caused it” is where most incident response time is actually spent, and it’s the gap that monitoring tools have historically left open.
The Detection-To-Resolution Gap
Internet Performance Monitoring is mature at detection. Synthetic tests catch failures in seconds. Real User Monitoring surfaces experience degradation as it happens. BGP and DNS monitoring flag routing anomalies before they cascade. The tooling to know that something is wrong is mature.
The tooling to know what caused it hasn’t kept pace. When an outage involves multiple services, CDNs, DNS providers, third-party APIs, and upstream dependencies, the root cause isn’t immediately obvious from the alert. An engineer staring at a waterfall chart at 3 AM still has to determine whether the latency spike is coming from a CDN reconfiguration, a DNS propagation delay, an upstream API timeout, or something else entirely.
That investigation process is manual, experience-dependent, and slow. It’s also where mean time to repair (MTTR) balloons. Detection might take seconds. Resolution might take hours, and the majority of that time is spent figuring out what to fix, not fixing it.
Root Cause Analysis (RCA) and Advisor are two LM Internet Performance Monitoring capabilities designed to close that gap. Built into Internet Stack Map, RCA pinpoints the responsible service. Advisor identifies what you should be monitoring but aren’t. Together, they move teams from detection to resolution faster, with less guesswork and less dependence on tribal knowledge.
How Root Cause Analysis Works
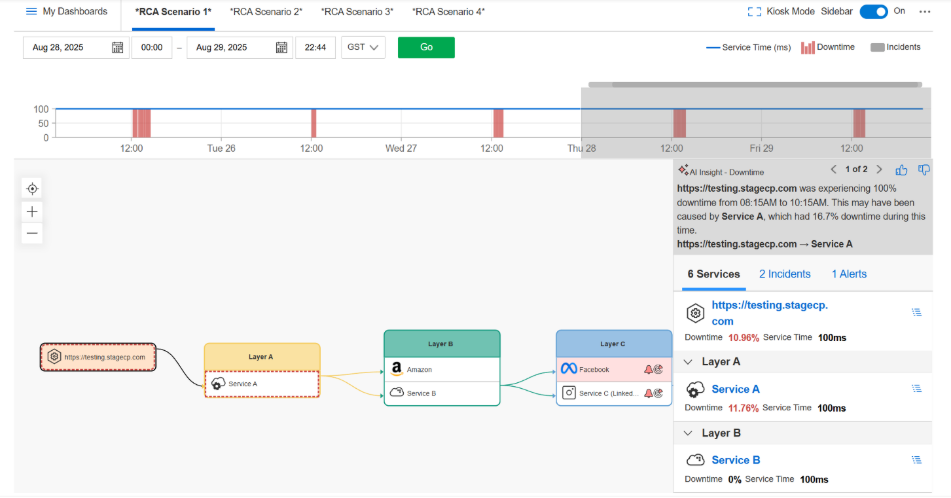
RCA operates within Internet Stack Map, which intelligently maps every service in your Internet delivery chain. When a failure is detected, RCA analyzes the backend waterfall data across the entire service path to identify the primary service responsible for the issue.
Instead of simply pattern-matching against generic failure signatures, RCA examines the specific services in your environment, during the timeframe of your incident, using your actual monitoring data. It correlates outage signals across the dependency tree to determine which service failure is causing downstream impact, and it surfaces that finding directly in the Internet Stack Map interface.
The practical difference is significant. Instead of manually inspecting each service in the chain, checking waterfall timings, and correlating events across multiple views, the on-call engineer gets a clear identification of the responsible service. That changes a 30-minute investigation into one that takes minutes.
RCA only surfaces root causes that are relevant to what you’re investigating. If a DNS provider is experiencing latency, but it isn’t affecting your primary service, RCA won’t flag it as the root cause. That specificity reduces false positives and maintains a high signal-to-noise ratio during incidents.
How Advisor Closes Coverage Gaps
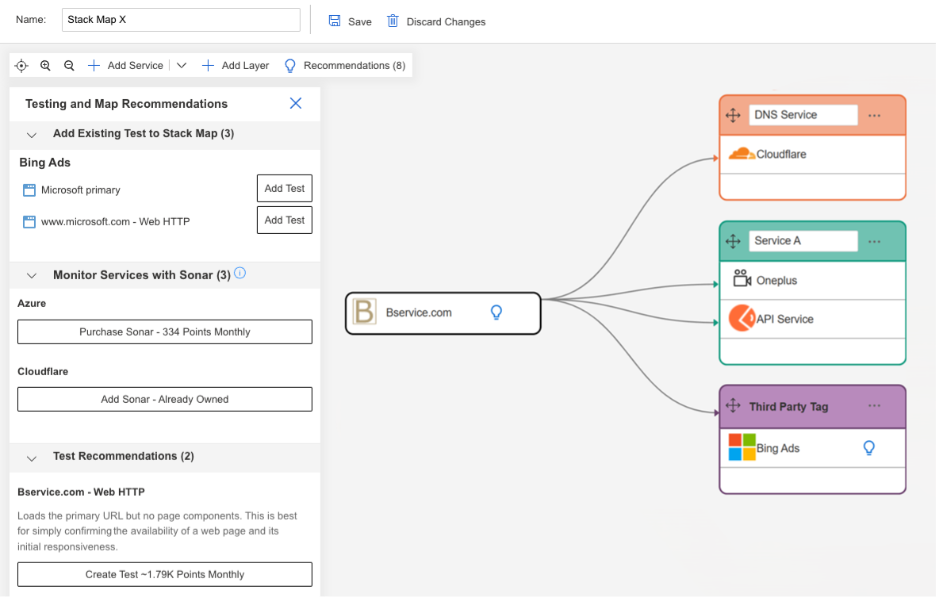
Catchpoint Advisor also operates within Internet Stack Map, but it addresses a different problem: the dependencies you don’t have visibility into yet. It evaluates your current monitoring configuration against your actual service dependency map and identifies gaps.
When Advisor finds a dependency that isn’t covered by an active test, it recommends the appropriate monitoring. That includes HTTP tests, Chrome browser tests, SSL checks, traceroutes, DNS monitoring, and Internet Sonar services for third-party dependencies. Advisor goes further by pre-configuring the recommended tests with appropriate thresholds and alert settings, so you can deploy them with minimal setup.
This matters because coverage gaps are often invisible until they cause an incident. A CDN that isn’t being monitored, a DNS provider without active checks, an upstream API with no synthetic test: these are the blind spots that turn a diagnosable problem into a mystery. Advisor surfaces them proactively, before the 3 AM page.
The On-Call Workflow With RCA And Advisor
When both capabilities are active, the incident response workflow changes in practical ways.
An alert fires. The on-call engineer opens Internet Stack Map and sees the affected service path. RCA has already analyzed the waterfall data and identified the responsible service. Instead of starting a manual investigation across every dependency, the engineer can go directly to the root cause, verify it, and begin remediation.
After the incident, Advisor might flag that the service which caused the outage didn’t have adequate monitoring coverage to begin with, or that a related dependency is similarly unmonitored. The engineer can deploy the recommended tests to prevent the same blind spot from causing a repeat incident.
Over time, this creates a feedback loop. Each incident improves monitoring coverage. Each coverage improvement makes the next incident easier to diagnose. The operational knowledge that used to live in one senior engineer’s head becomes part of the monitoring configuration.
As LogicMonitor CEO Mehdi Daoudi put it, “AI should remove complexity, not add to it.” RCA and Advisor are built around that principle. They surface in the Internet Stack Map interface when relevant data is available. There are no separate dashboards to check, no additional enablement steps, and no extra costs beyond existing Internet Stack Map usage.
From IPM To Autonomous IT
RCA and Advisor handle a critical part of the incident lifecycle: narrowing the gap between detection and resolution within the Internet stack. But the Internet stack is one piece of a larger picture. Most enterprise incidents involve interactions between internal infrastructure, applications, cloud services, and Internet dependencies. Diagnosing a problem that spans all of those layers requires visibility and intelligence across the full delivery path.
That’s the role of Edwin AI. Where RCA and Advisor work within Catchpoint IPM to analyze Internet-layer dependencies, Edwin AI operates across the full LogicMonitor platform, correlating telemetry from infrastructure (LM Envision), Internet and experience monitoring (Catchpoint), and application performance data into a single context graph.
Before Catchpoint’s Internet telemetry was integrated, Edwin AI could reason about infrastructure and applications but treated the Internet as a black box. With that gap closed, Edwin AI can now answer questions like “is this an infrastructure problem or an Internet problem?” in seconds, by correlating signals across all three layers.
The practical impact is measurable. SAP reports receiving alerts in seconds and identifying root cause in three minutes. Verizon has seen 4x faster problem identification and a 90% reduction in false alerts. These outcomes come from having a single intelligence layer that operates across infrastructure and Internet data simultaneously, rather than teams context-switching between disconnected tools.
You can’t automate across a gap in your data. RCA and Advisor eliminate the gap within Internet performance monitoring. Edwin AI extends that intelligence across the full stack, moving teams closer to Autonomous IT, where detection, diagnosis, and resolution happen as a continuous, governed workflow rather than a series of manual handoffs.
Read This Next
Every on-call engineer knows the moment. The dashboard turns red across multiple services, the PagerDuty notification fires, and the investigation begins. You can see that something is broken. Latency is spiking. Error rates are climbing. But the dashboard doesn’t tell you why. It doesn’t tell you which of the fifteen services in your delivery chain is actually responsible, or which dependency three layers deep triggered the cascade.
So you start the manual triage. Open the waterfall. Inspect each hop. Cross-reference with recent deployments. Ping the person in Slack who dealt with something similar six months ago. The gap between “we detected a problem” and “we know what caused it” is where most incident response time is actually spent, and it’s the gap that monitoring tools have historically left open.
The Detection-To-Resolution Gap
Internet Performance Monitoring is mature at detection. Synthetic tests catch failures in seconds. Real User Monitoring surfaces experience degradation as it happens. BGP and DNS monitoring flag routing anomalies before they cascade. The tooling to know that something is wrong is mature.
The tooling to know what caused it hasn’t kept pace. When an outage involves multiple services, CDNs, DNS providers, third-party APIs, and upstream dependencies, the root cause isn’t immediately obvious from the alert. An engineer staring at a waterfall chart at 3 AM still has to determine whether the latency spike is coming from a CDN reconfiguration, a DNS propagation delay, an upstream API timeout, or something else entirely.
That investigation process is manual, experience-dependent, and slow. It’s also where mean time to repair (MTTR) balloons. Detection might take seconds. Resolution might take hours, and the majority of that time is spent figuring out what to fix, not fixing it.
Root Cause Analysis (RCA) and Advisor are two LM Internet Performance Monitoring capabilities designed to close that gap. Built into Internet Stack Map, RCA pinpoints the responsible service. Advisor identifies what you should be monitoring but aren’t. Together, they move teams from detection to resolution faster, with less guesswork and less dependence on tribal knowledge.
How Root Cause Analysis Works
RCA operates within Internet Stack Map, which intelligently maps every service in your Internet delivery chain. When a failure is detected, RCA analyzes the backend waterfall data across the entire service path to identify the primary service responsible for the issue.
Instead of simply pattern-matching against generic failure signatures, RCA examines the specific services in your environment, during the timeframe of your incident, using your actual monitoring data. It correlates outage signals across the dependency tree to determine which service failure is causing downstream impact, and it surfaces that finding directly in the Internet Stack Map interface.
The practical difference is significant. Instead of manually inspecting each service in the chain, checking waterfall timings, and correlating events across multiple views, the on-call engineer gets a clear identification of the responsible service. That changes a 30-minute investigation into one that takes minutes.
RCA only surfaces root causes that are relevant to what you’re investigating. If a DNS provider is experiencing latency, but it isn’t affecting your primary service, RCA won’t flag it as the root cause. That specificity reduces false positives and maintains a high signal-to-noise ratio during incidents.
How Advisor Closes Coverage Gaps
Catchpoint Advisor also operates within Internet Stack Map, but it addresses a different problem: the dependencies you don’t have visibility into yet. It evaluates your current monitoring configuration against your actual service dependency map and identifies gaps.
When Advisor finds a dependency that isn’t covered by an active test, it recommends the appropriate monitoring. That includes HTTP tests, Chrome browser tests, SSL checks, traceroutes, DNS monitoring, and Internet Sonar services for third-party dependencies. Advisor goes further by pre-configuring the recommended tests with appropriate thresholds and alert settings, so you can deploy them with minimal setup.
This matters because coverage gaps are often invisible until they cause an incident. A CDN that isn’t being monitored, a DNS provider without active checks, an upstream API with no synthetic test: these are the blind spots that turn a diagnosable problem into a mystery. Advisor surfaces them proactively, before the 3 AM page.
The On-Call Workflow With RCA And Advisor
When both capabilities are active, the incident response workflow changes in practical ways.
An alert fires. The on-call engineer opens Internet Stack Map and sees the affected service path. RCA has already analyzed the waterfall data and identified the responsible service. Instead of starting a manual investigation across every dependency, the engineer can go directly to the root cause, verify it, and begin remediation.
After the incident, Advisor might flag that the service which caused the outage didn’t have adequate monitoring coverage to begin with, or that a related dependency is similarly unmonitored. The engineer can deploy the recommended tests to prevent the same blind spot from causing a repeat incident.
Over time, this creates a feedback loop. Each incident improves monitoring coverage. Each coverage improvement makes the next incident easier to diagnose. The operational knowledge that used to live in one senior engineer’s head becomes part of the monitoring configuration.
As LogicMonitor CEO Mehdi Daoudi put it, “AI should remove complexity, not add to it.” RCA and Advisor are built around that principle. They surface in the Internet Stack Map interface when relevant data is available. There are no separate dashboards to check, no additional enablement steps, and no extra costs beyond existing Internet Stack Map usage.
From IPM To Autonomous IT
RCA and Advisor handle a critical part of the incident lifecycle: narrowing the gap between detection and resolution within the Internet stack. But the Internet stack is one piece of a larger picture. Most enterprise incidents involve interactions between internal infrastructure, applications, cloud services, and Internet dependencies. Diagnosing a problem that spans all of those layers requires visibility and intelligence across the full delivery path.
That’s the role of Edwin AI. Where RCA and Advisor work within Catchpoint IPM to analyze Internet-layer dependencies, Edwin AI operates across the full LogicMonitor platform, correlating telemetry from infrastructure (LM Envision), Internet and experience monitoring (Catchpoint), and application performance data into a single context graph.
Before Catchpoint’s Internet telemetry was integrated, Edwin AI could reason about infrastructure and applications but treated the Internet as a black box. With that gap closed, Edwin AI can now answer questions like “is this an infrastructure problem or an Internet problem?” in seconds, by correlating signals across all three layers.
The practical impact is measurable. SAP reports receiving alerts in seconds and identifying root cause in three minutes. Verizon has seen 4x faster problem identification and a 90% reduction in false alerts. These outcomes come from having a single intelligence layer that operates across infrastructure and Internet data simultaneously, rather than teams context-switching between disconnected tools.
You can’t automate across a gap in your data. RCA and Advisor eliminate the gap within Internet performance monitoring. Edwin AI extends that intelligence across the full stack, moving teams closer to Autonomous IT, where detection, diagnosis, and resolution happen as a continuous, governed workflow rather than a series of manual handoffs.