The inside story of a SaaS routing decision gone wrong (or right)
Most operations teams trust their green dashboards. If internal monitoring looks healthy, the assumption is that the app is performing fine. But as the Internet keeps proving, what’s green inside your infrastructure can look red for customers outside of it. Sometimes, a single change in how web traffic moves can suddenly slow logins, disrupt websites, or hurt business results, even if everything looks fine inside.
This happened recently to a global SaaS platform specializing in IT service management and workflow automation. When they changed their IP routing strategy (essentially, how they send traffic to customers), nothing broke internally. SLAs looked clean. But customers suffered slowed logins, and the kind of unpredictable, frustrating performance that’s often caused by spiky SSL handshakes behind the scenes.
The cause? A quiet BGP routing decision that flipped how traffic moved across the US. This was a lesson in how IT decisions shape what real people experience, every day. Below is what happened, why it matters for every business, and what teams need to learn to avoid hidden pain points.
When a Network Decision Becomes a Customer Issue
Browser-based performance tests revealed just how much the routing change affected login times and security handshakes across the country, sometimes multiplying delays tenfold.
The data showed:
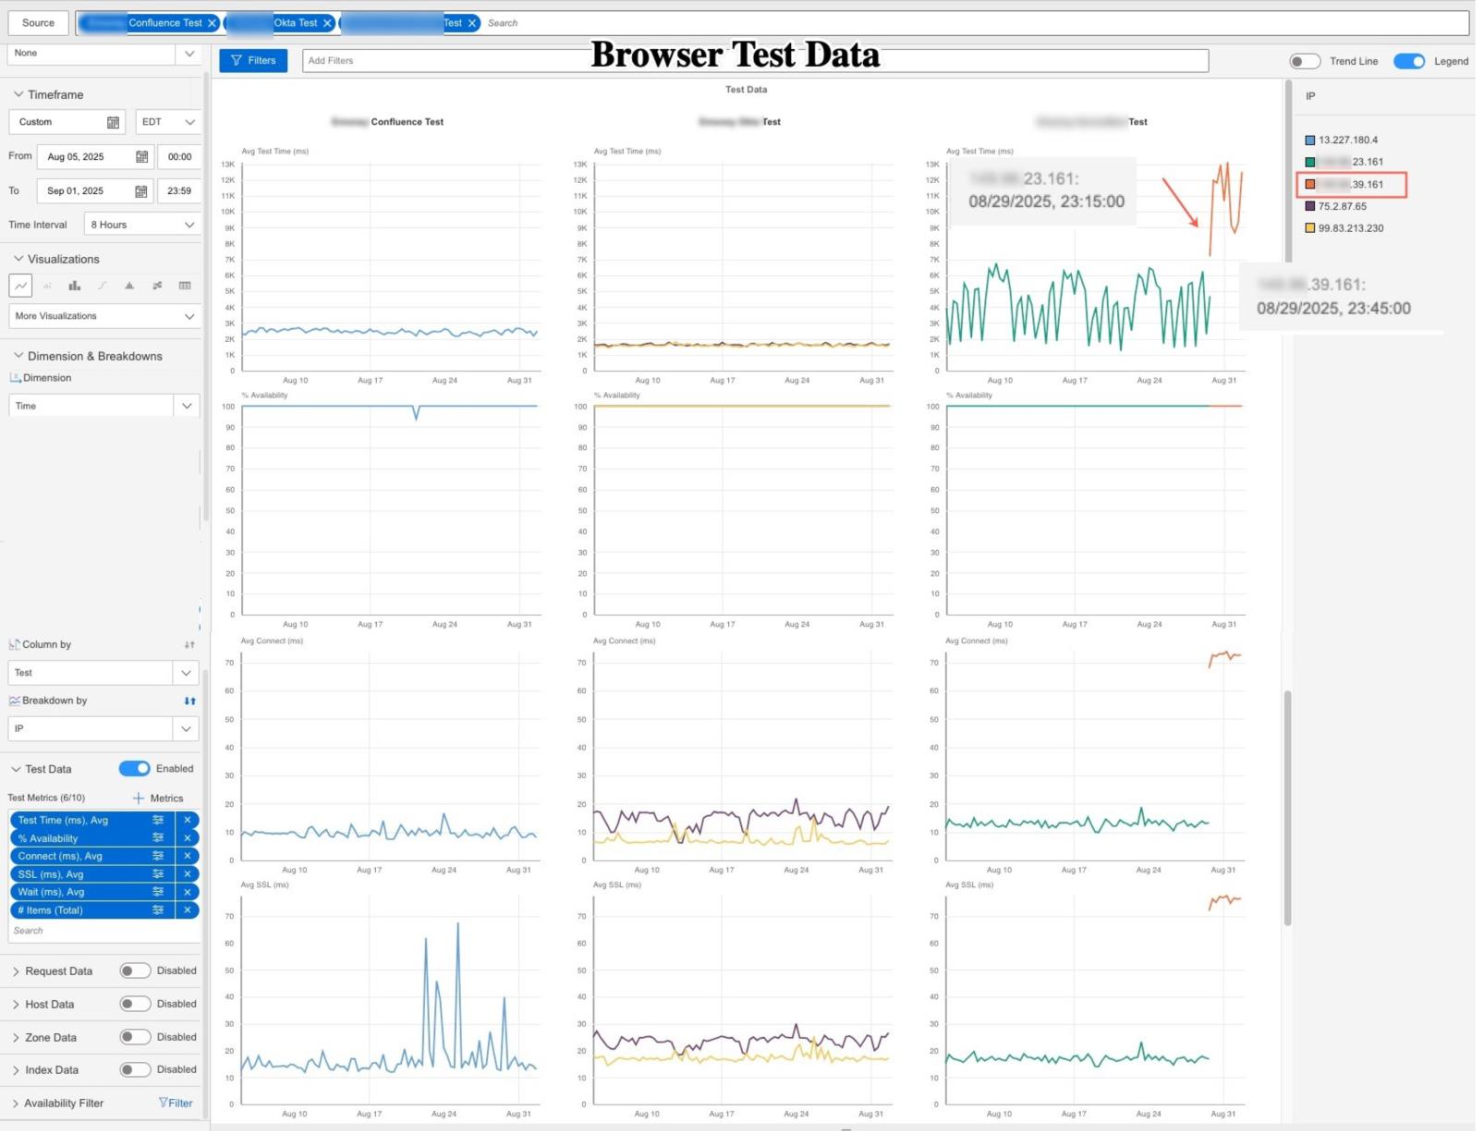
Browser-based tests reveal dramatic regional shifts in login speed after a BGP routing change: East Coast latency surged while Midwest and West users saw significant improvement
What Was Changed: /24 vs /20
Until late August, most customers were using addresses in a specific range, the ‘/24 block’ (for the tech crowd: X.X.23.0/24) routed through a security service called Neustar. Neustar has connections across the country, which helped speed up traffic and protected users from online threats. For customers on the East Coast (like Philadelphia), this setup meant web requests reached the provider quickly, with response times around 9 milliseconds and minimal delays.
Then came the pivotal change. The SaaS provider moved customers from those addresses to a larger pool called the “/20 block.” On paper, this looked like a routine update. In practice, it was a big deal: it meant Neustar was no longer guiding the traffic. Instead, customers’ data was sent directly over the internet using providers like Lumen.
This was especially rough for East Coast users. Their requests now had to take a much longer journey, getting bounced across the country before arriving at the destination server in Phoenix. Users felt the pain immediately. Latency shot up by 10x, and basic tasks like logging in or establishing a secure connection suddenly took 5 to 10 times longer. For customers, everything just felt slow.
How the Changes Played Out in Three Cities
This BGP flip essentially redistributed who suffered and who benefited. These changes played out differently in three real cities, backed by the browser-based measurements above:
Philadelphia (East Coast):
- Before:
Fast route (via Neustar), response time: ~9 ms - After:
Traffic sent on a long detour through Phoenix, response time: ~61 ms - Impact:
Local users waited over 50 ms longer for everything to load.
Denver (Midwest):
- Before:
Multiple cross-country hops, slow and shaky (~93 ms, jitter: 45 ms) - After:
More direct path, smoother and much faster (~51 ms, jitter: 15 ms) - Impact:
Central US users saw a big speed boost and fewer hiccups.
Phoenix (West):
- Before:
Odd detours, not local as expected (~69 ms even though they were close) - After:
Data routed the short way, response time: ~17 ms - Impact:
West Coast users finally got the speed they should have had all along.
The numbers tell part of the story. Traceroute tests mapped out the journey customer traffic actually took before and after the routing shift. These show each handoff along the way, from city to city and network to network, offering clear, visual proof of what caused the delays (or improvements).
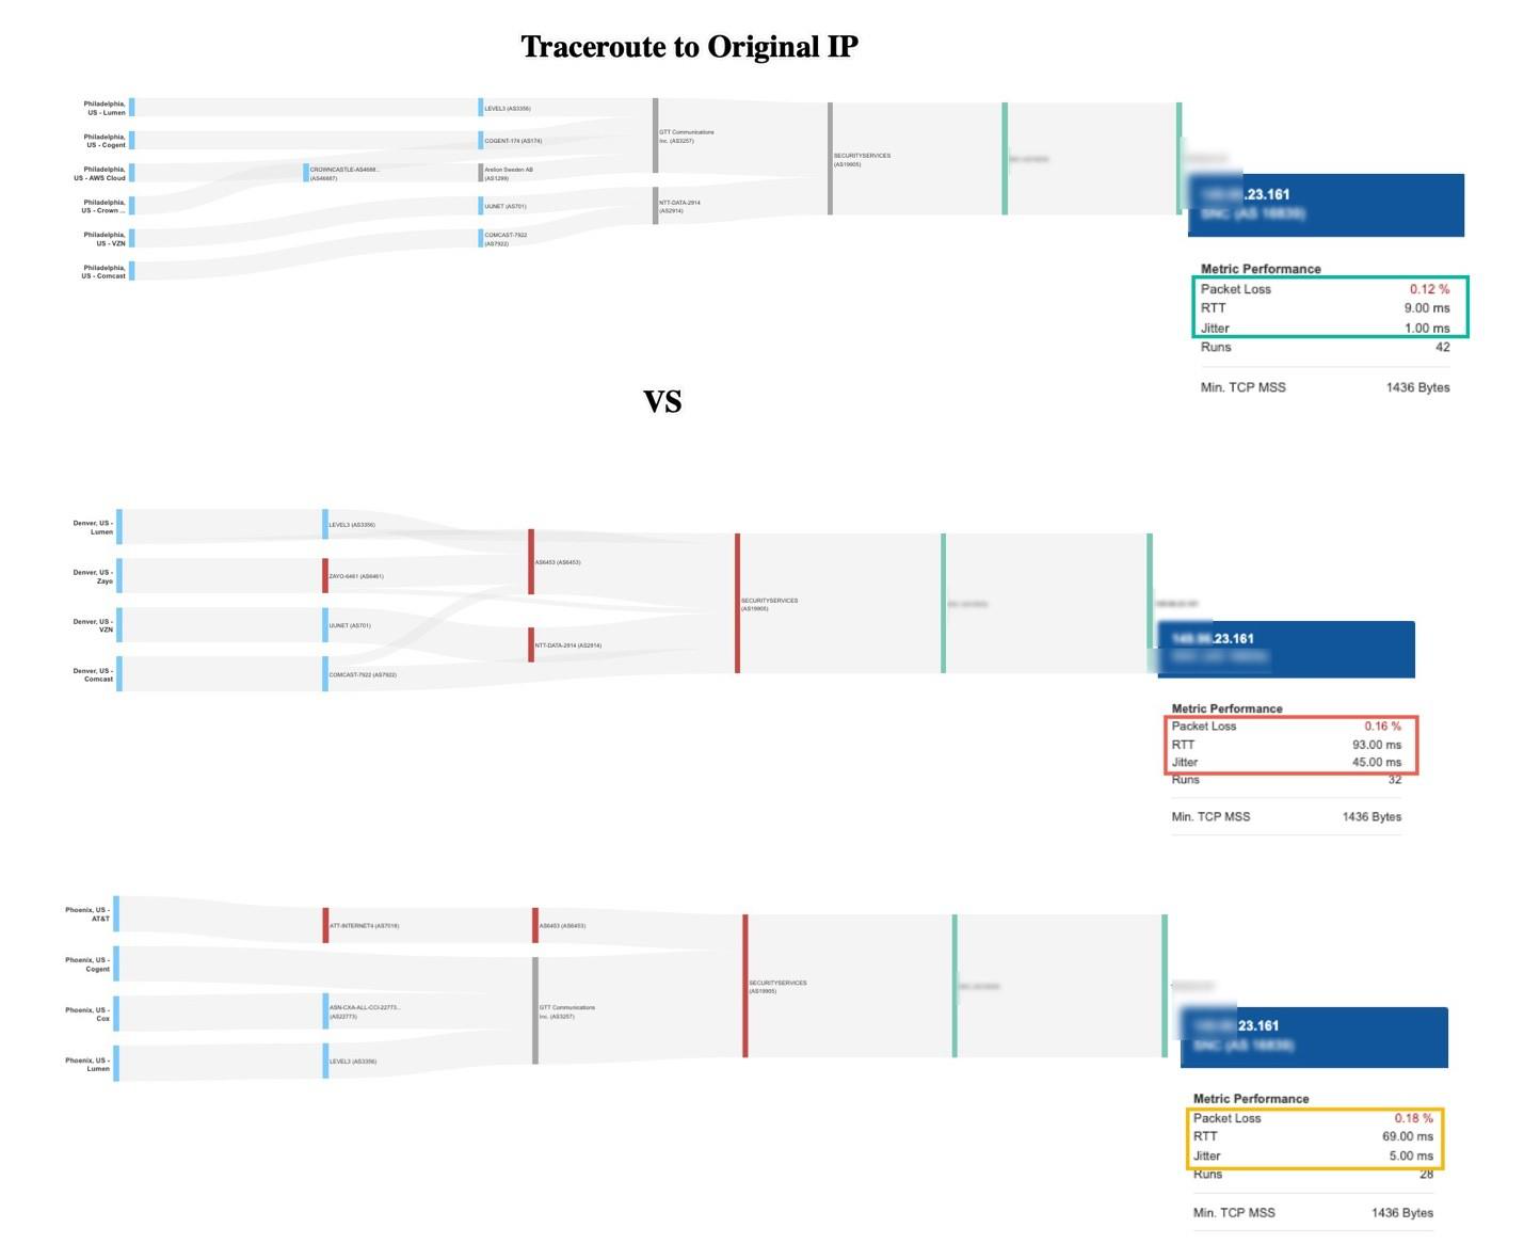
These traceroutes highlight how routing impacted real user performance: fast for some, slow and inconsistent for others, even before the major change
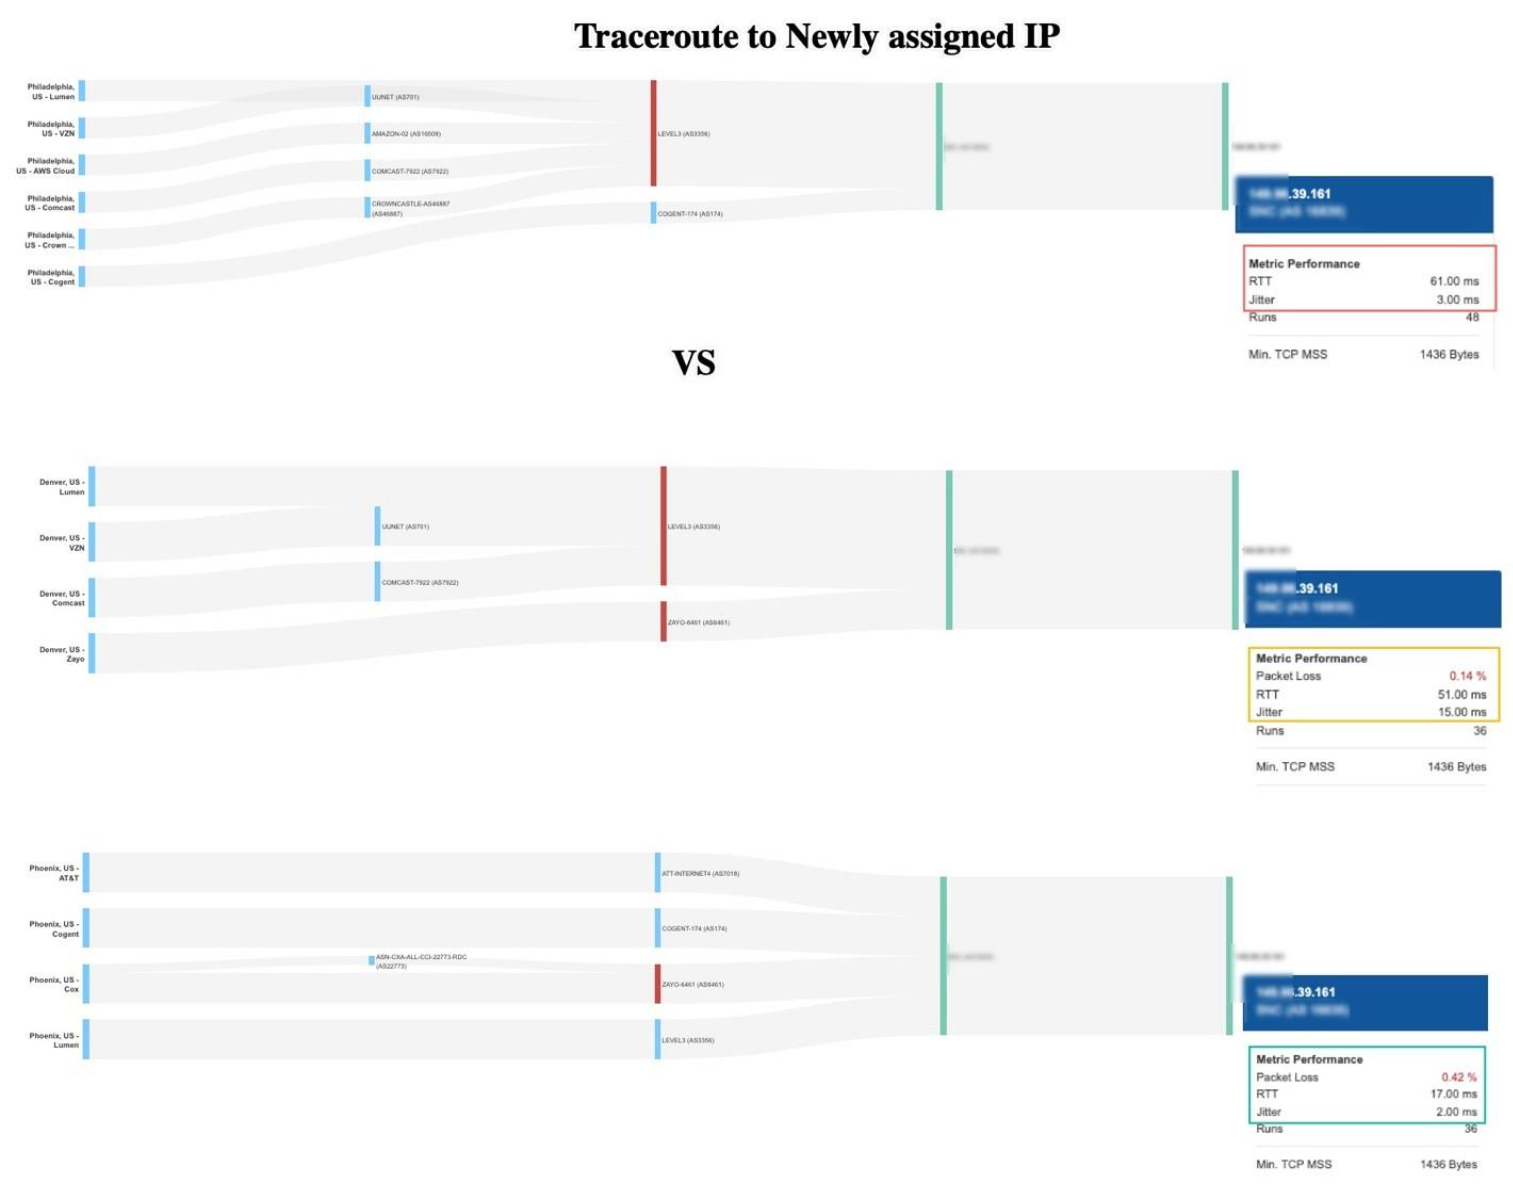
Traceroutes showing how the /24 anchored better for the East. The /20 anchored better for the West and Midwest. Neither strategy was consistent nationwide.
Why Neustar Mattered, and What Changed When It Was Removed
AS19905 is Vercara (formerly Neustar Security Services), widely used for DDoS mitigation and traffic scrubbing. For the SaaS platform, Neustar wasn’t just speeding up traffic; it acted as a key security and routing partner in the network. By running data through Neustar, the SaaS provider gave many customers a faster, more direct journey, with extra protections along the way. For East Coast users, this meant fast connections and reliable performance.
The routing split had consequences beyond latency, because it also changed the security posture for a portion of the customer base. After the routing change, some customers stayed on blocks that still pass through Neustar, getting their traffic scrubbed and distributed efficiently. Others were placed on new blocks that send data directly over major internet providers like Lumen, AT&T, NTT, GTT, or Zayo.
The impact depends on which group you belong to. Some users continue to benefit from both high security and fast delivery; others have a longer, less protected route, with more potential for delays.
Neustar’s “hidden role” meant a better, safer, and faster experience for part of the customer base. Removing it and changing how blocks are routed intentionally redrew the map of user pain and performance.
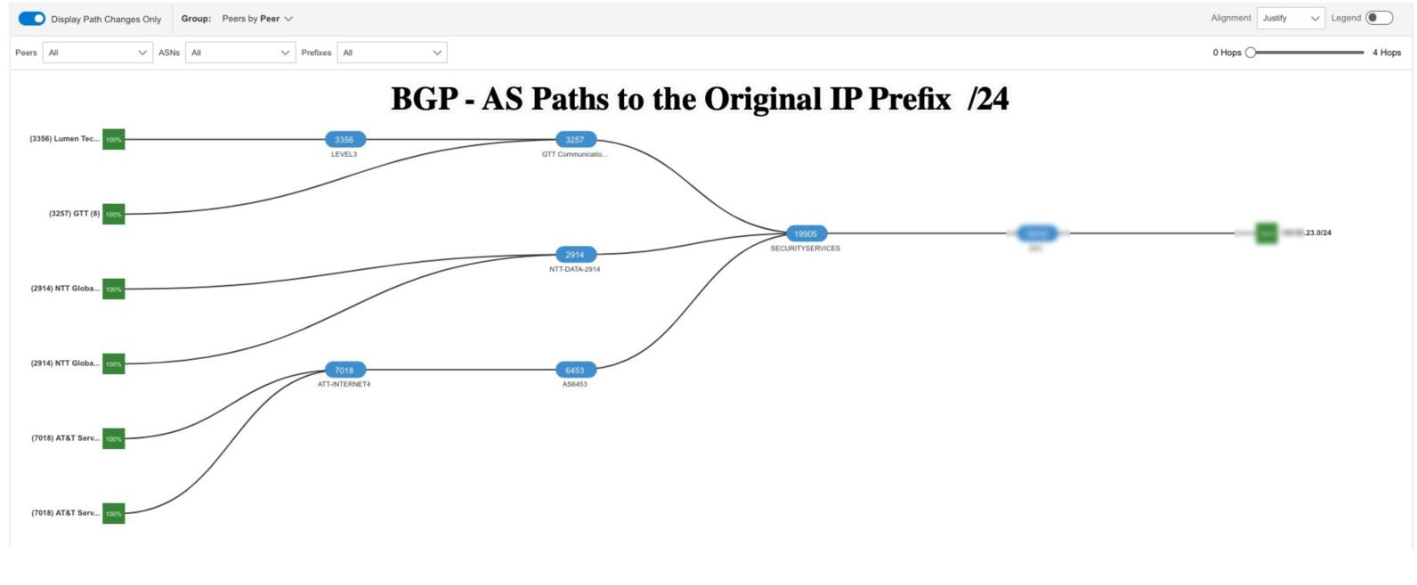
BGP routing before the change
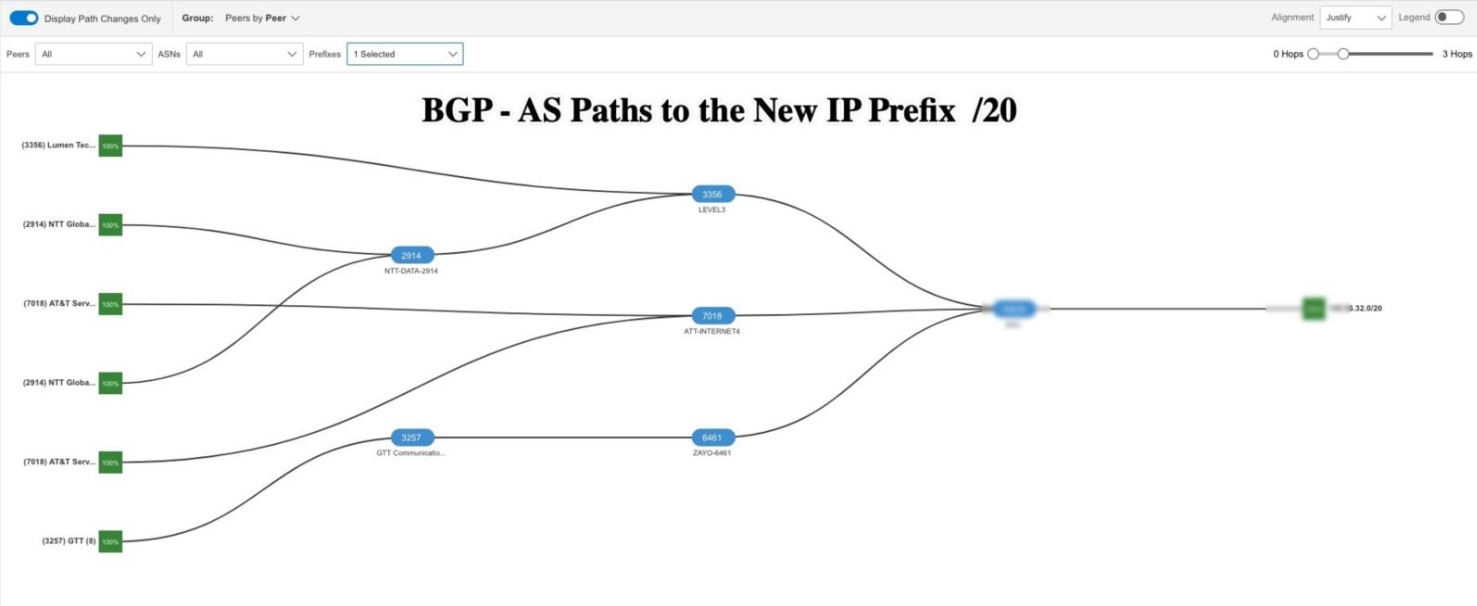
BGP routing after the change
Incident Timeline
- July to August 2025: Customers primarily on X.X.23.0/24, routed via Neustar. East Coast enjoyed best performance; West Coast users connecting to the same IP were penalized.
- Late August 2025: SaaS provider moves tenants to X.X.39.0/24 within the X.X.32.0/20 block, bypassing Neustar. East Coast latency jumps; West improves overall.
- September 15 to 18, 2025: BGP monitoring shows X.X.23.0/24 withdrawn globally. Reachability drops to zero, confirming decommission of the old block.
- October 2025 (present): Only the /20 remains in play, with its uneven routing. This is no longer an anomaly; it’s the permanent architecture.
How to Stay Ahead of BGP-Driven UX Surprises
From an enterprise perspective, the priority was vendor accountability. With Catchpoint Internet Performance Monitoring (IPM), part of the LogicMonitor platform, the ops team had browser tests, traceroutes, and BGP visualizations that provided undeniable evidence: the SaaS provider’s routing choice degraded East Coast performance. They could escalate with proof, not speculation.
This case shows what teams miss without external Internet monitoring:
- SaaS routing shifts that happen before customers start complaining.
- Security layers (like DDoS scrubbing) that vanish or change without notice.
- The hard evidence needed to hold vendors accountable.
- User experience as it actually happens, outside your firewall.
LogicMonitor unifies LM Envision, Catchpoint IPM, and Edwin AI into one Autonomous IT platform, giving teams the internal infrastructure monitoring, external Internet visibility, and AI-driven intelligence needed to catch these kinds of issues before they become customer complaints.
The Internet Is Now Your User Experience
The Internet is now your production stack. A SaaS provider’s decision to announce a /20 instead of a /24 isn’t a routing artifact; it’s a user experience event. East Coast logins slowed because BGP policy shifted. West Coast users saw significant improvements while Philadelphia experienced degraded performance. That’s the reality of Internet-scale delivery.
Green dashboards inside the enterprise won’t tell you this. Internet Performance Monitoring provides teams the outside-in view that shows what customers actually experience when BGP shifts.
Most operations teams trust their green dashboards. If internal monitoring looks healthy, the assumption is that the app is performing fine. But as the Internet keeps proving, what’s green inside your infrastructure can look red for customers outside of it. Sometimes, a single change in how web traffic moves can suddenly slow logins, disrupt websites, or hurt business results, even if everything looks fine inside.
This happened recently to a global SaaS platform specializing in IT service management and workflow automation. When they changed their IP routing strategy (essentially, how they send traffic to customers), nothing broke internally. SLAs looked clean. But customers suffered slowed logins, and the kind of unpredictable, frustrating performance that’s often caused by spiky SSL handshakes behind the scenes.
The cause? A quiet BGP routing decision that flipped how traffic moved across the US. This was a lesson in how IT decisions shape what real people experience, every day. Below is what happened, why it matters for every business, and what teams need to learn to avoid hidden pain points.
When a Network Decision Becomes a Customer Issue
Browser-based performance tests revealed just how much the routing change affected login times and security handshakes across the country, sometimes multiplying delays tenfold.
The data showed:
Browser-based tests reveal dramatic regional shifts in login speed after a BGP routing change: East Coast latency surged while Midwest and West users saw significant improvement
What Was Changed: /24 vs /20
Until late August, most customers were using addresses in a specific range, the ‘/24 block’ (for the tech crowd: X.X.23.0/24) routed through a security service called Neustar. Neustar has connections across the country, which helped speed up traffic and protected users from online threats. For customers on the East Coast (like Philadelphia), this setup meant web requests reached the provider quickly, with response times around 9 milliseconds and minimal delays.
Then came the pivotal change. The SaaS provider moved customers from those addresses to a larger pool called the “/20 block.” On paper, this looked like a routine update. In practice, it was a big deal: it meant Neustar was no longer guiding the traffic. Instead, customers’ data was sent directly over the internet using providers like Lumen.
This was especially rough for East Coast users. Their requests now had to take a much longer journey, getting bounced across the country before arriving at the destination server in Phoenix. Users felt the pain immediately. Latency shot up by 10x, and basic tasks like logging in or establishing a secure connection suddenly took 5 to 10 times longer. For customers, everything just felt slow.
How the Changes Played Out in Three Cities
This BGP flip essentially redistributed who suffered and who benefited. These changes played out differently in three real cities, backed by the browser-based measurements above:
Philadelphia (East Coast):
- Before:
Fast route (via Neustar), response time: ~9 ms - After:
Traffic sent on a long detour through Phoenix, response time: ~61 ms - Impact:
Local users waited over 50 ms longer for everything to load.
Denver (Midwest):
- Before:
Multiple cross-country hops, slow and shaky (~93 ms, jitter: 45 ms) - After:
More direct path, smoother and much faster (~51 ms, jitter: 15 ms) - Impact:
Central US users saw a big speed boost and fewer hiccups.
Phoenix (West):
- Before:
Odd detours, not local as expected (~69 ms even though they were close) - After:
Data routed the short way, response time: ~17 ms - Impact:
West Coast users finally got the speed they should have had all along.
The numbers tell part of the story. Traceroute tests mapped out the journey customer traffic actually took before and after the routing shift. These show each handoff along the way, from city to city and network to network, offering clear, visual proof of what caused the delays (or improvements).
These traceroutes highlight how routing impacted real user performance: fast for some, slow and inconsistent for others, even before the major change
Traceroutes showing how the /24 anchored better for the East. The /20 anchored better for the West and Midwest. Neither strategy was consistent nationwide.
Why Neustar Mattered, and What Changed When It Was Removed
AS19905 is Vercara (formerly Neustar Security Services), widely used for DDoS mitigation and traffic scrubbing. For the SaaS platform, Neustar wasn’t just speeding up traffic; it acted as a key security and routing partner in the network. By running data through Neustar, the SaaS provider gave many customers a faster, more direct journey, with extra protections along the way. For East Coast users, this meant fast connections and reliable performance.
The routing split had consequences beyond latency, because it also changed the security posture for a portion of the customer base. After the routing change, some customers stayed on blocks that still pass through Neustar, getting their traffic scrubbed and distributed efficiently. Others were placed on new blocks that send data directly over major internet providers like Lumen, AT&T, NTT, GTT, or Zayo.
The impact depends on which group you belong to. Some users continue to benefit from both high security and fast delivery; others have a longer, less protected route, with more potential for delays.
Neustar’s “hidden role” meant a better, safer, and faster experience for part of the customer base. Removing it and changing how blocks are routed intentionally redrew the map of user pain and performance.
BGP routing before the change
BGP routing after the change
Incident Timeline
- July to August 2025: Customers primarily on X.X.23.0/24, routed via Neustar. East Coast enjoyed best performance; West Coast users connecting to the same IP were penalized.
- Late August 2025: SaaS provider moves tenants to X.X.39.0/24 within the X.X.32.0/20 block, bypassing Neustar. East Coast latency jumps; West improves overall.
- September 15 to 18, 2025: BGP monitoring shows X.X.23.0/24 withdrawn globally. Reachability drops to zero, confirming decommission of the old block.
- October 2025 (present): Only the /20 remains in play, with its uneven routing. This is no longer an anomaly; it’s the permanent architecture.
How to Stay Ahead of BGP-Driven UX Surprises
From an enterprise perspective, the priority was vendor accountability. With Catchpoint Internet Performance Monitoring (IPM), part of the LogicMonitor platform, the ops team had browser tests, traceroutes, and BGP visualizations that provided undeniable evidence: the SaaS provider’s routing choice degraded East Coast performance. They could escalate with proof, not speculation.
This case shows what teams miss without external Internet monitoring:
- SaaS routing shifts that happen before customers start complaining.
- Security layers (like DDoS scrubbing) that vanish or change without notice.
- The hard evidence needed to hold vendors accountable.
- User experience as it actually happens, outside your firewall.
LogicMonitor unifies LM Envision, Catchpoint IPM, and Edwin AI into one Autonomous IT platform, giving teams the internal infrastructure monitoring, external Internet visibility, and AI-driven intelligence needed to catch these kinds of issues before they become customer complaints.
The Internet Is Now Your User Experience
The Internet is now your production stack. A SaaS provider’s decision to announce a /20 instead of a /24 isn’t a routing artifact; it’s a user experience event. East Coast logins slowed because BGP policy shifted. West Coast users saw significant improvements while Philadelphia experienced degraded performance. That’s the reality of Internet-scale delivery.
Green dashboards inside the enterprise won’t tell you this. Internet Performance Monitoring provides teams the outside-in view that shows what customers actually experience when BGP shifts.