What’s new in Dynatrace SaaS 1.341 — Dynatrace Docs
- Release notes
- 15-min read
- Rollout start on Jun 16, 2026
This page showcases new features, changes, and bug fixes in Dynatrace SaaS version 1.341. It contains:
Platform | Smartscape
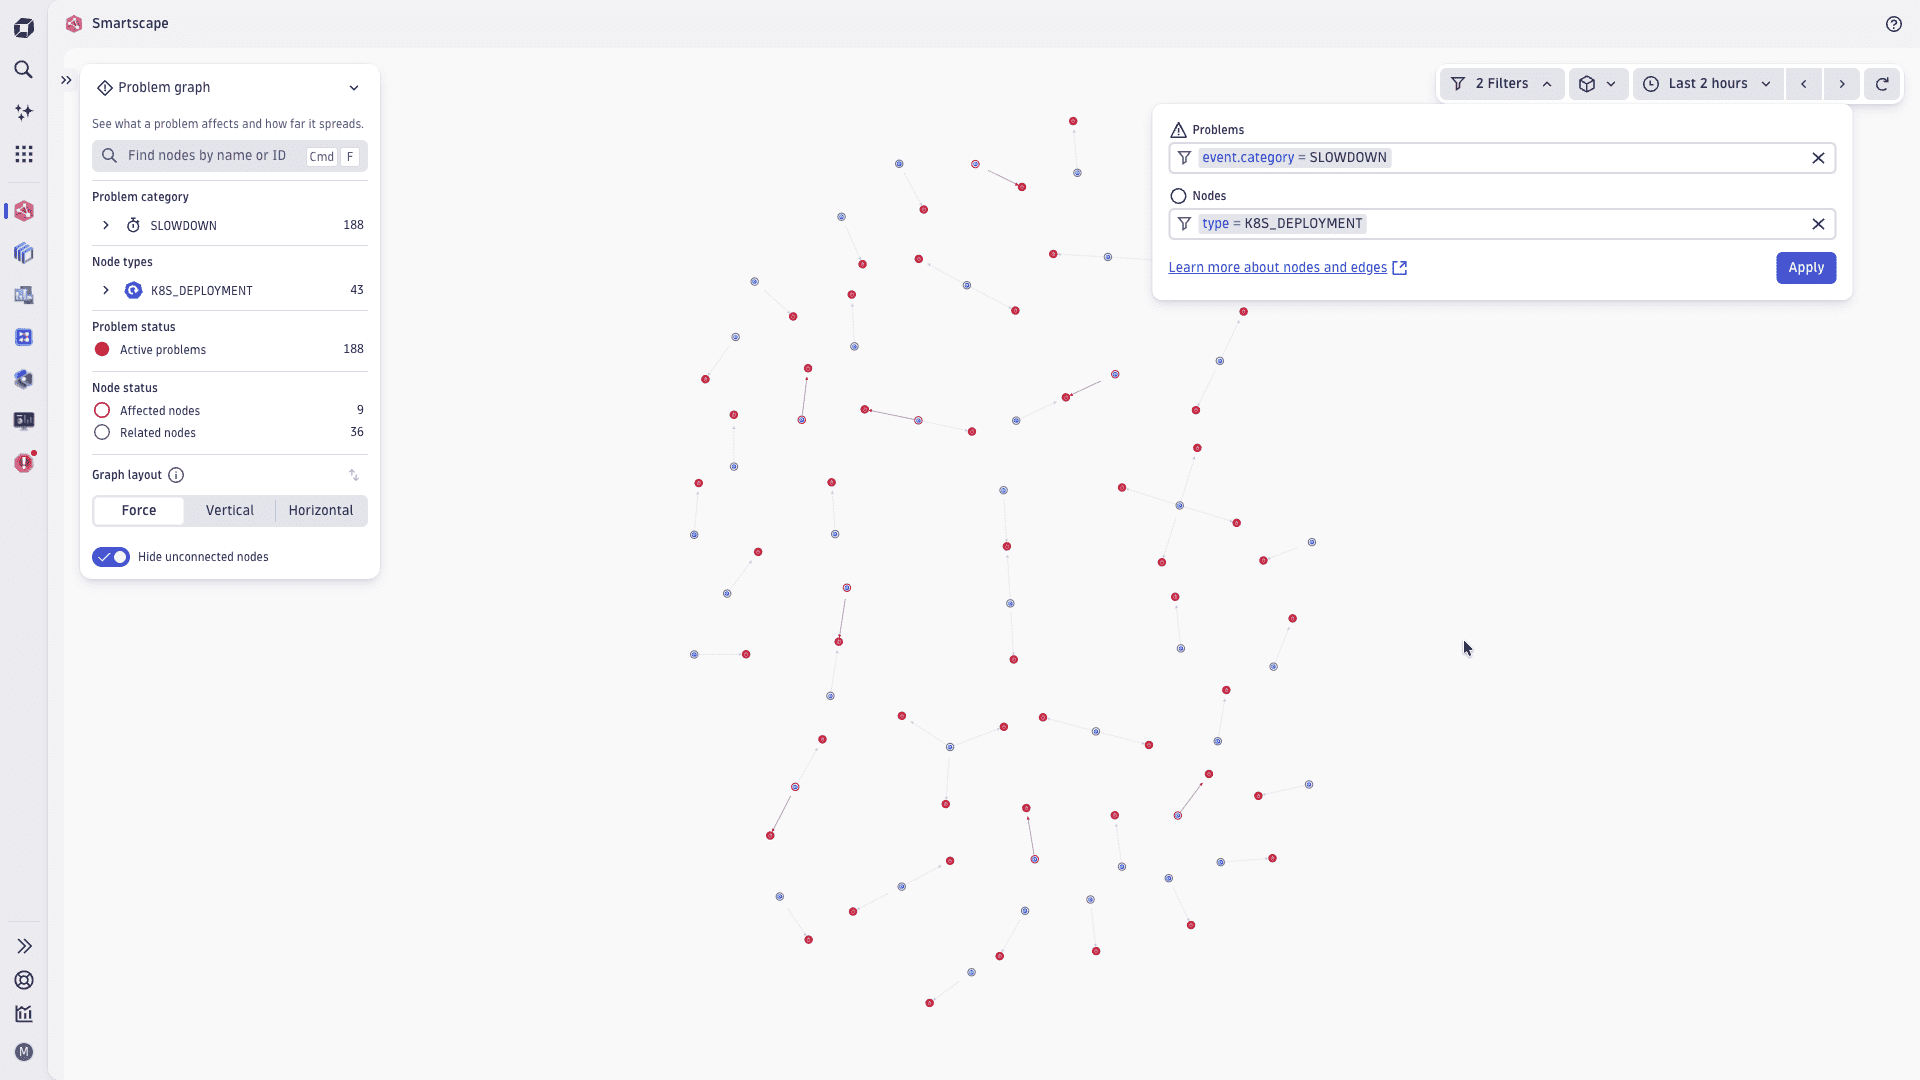
New Smartscape topology view, flat view migration, and ad-hoc filters
Explore all entity relationships in a single topology view
The new All topology view shows all relationships for a given Smartscape node in a single graph—the infrastructure stack, communication flows, and relationships such as monitoring, load balancing, routing, and API dependencies. Where the existing Vertical and Horizontal views each focus on a specific subset of relationships, the All topology view gives you the complete picture of what’s connected and how. The new view is available from any Smartscape node in any app across the Dynatrace platform.
AWS and Kubernetes views migrated to flat layouts
The AWS and Kubernetes views in Smartscape have been migrated from nested to flat layouts, aligning them with the rest of the Smartscape experience. You now benefit from the same relevance-based edge fetching and priority-driven node loading across your entire cloud landscape, giving you more consistent and complete visibility.
Narrow down Smartscape views with ad-hoc filters
Ad-hoc node and edge filters let you focus Smartscape views on what matters. Filter by node type, cloud and infrastructure labels, team ownership, environment, and other node and edge properties so each view reflects how your business is structured. Filters work alongside segments for quick, focused investigations. Filters are saved in the URL, so you can bookmark and share views with colleagues—segment, timeframe, and filters are preserved.
Feature updates
Application Observability
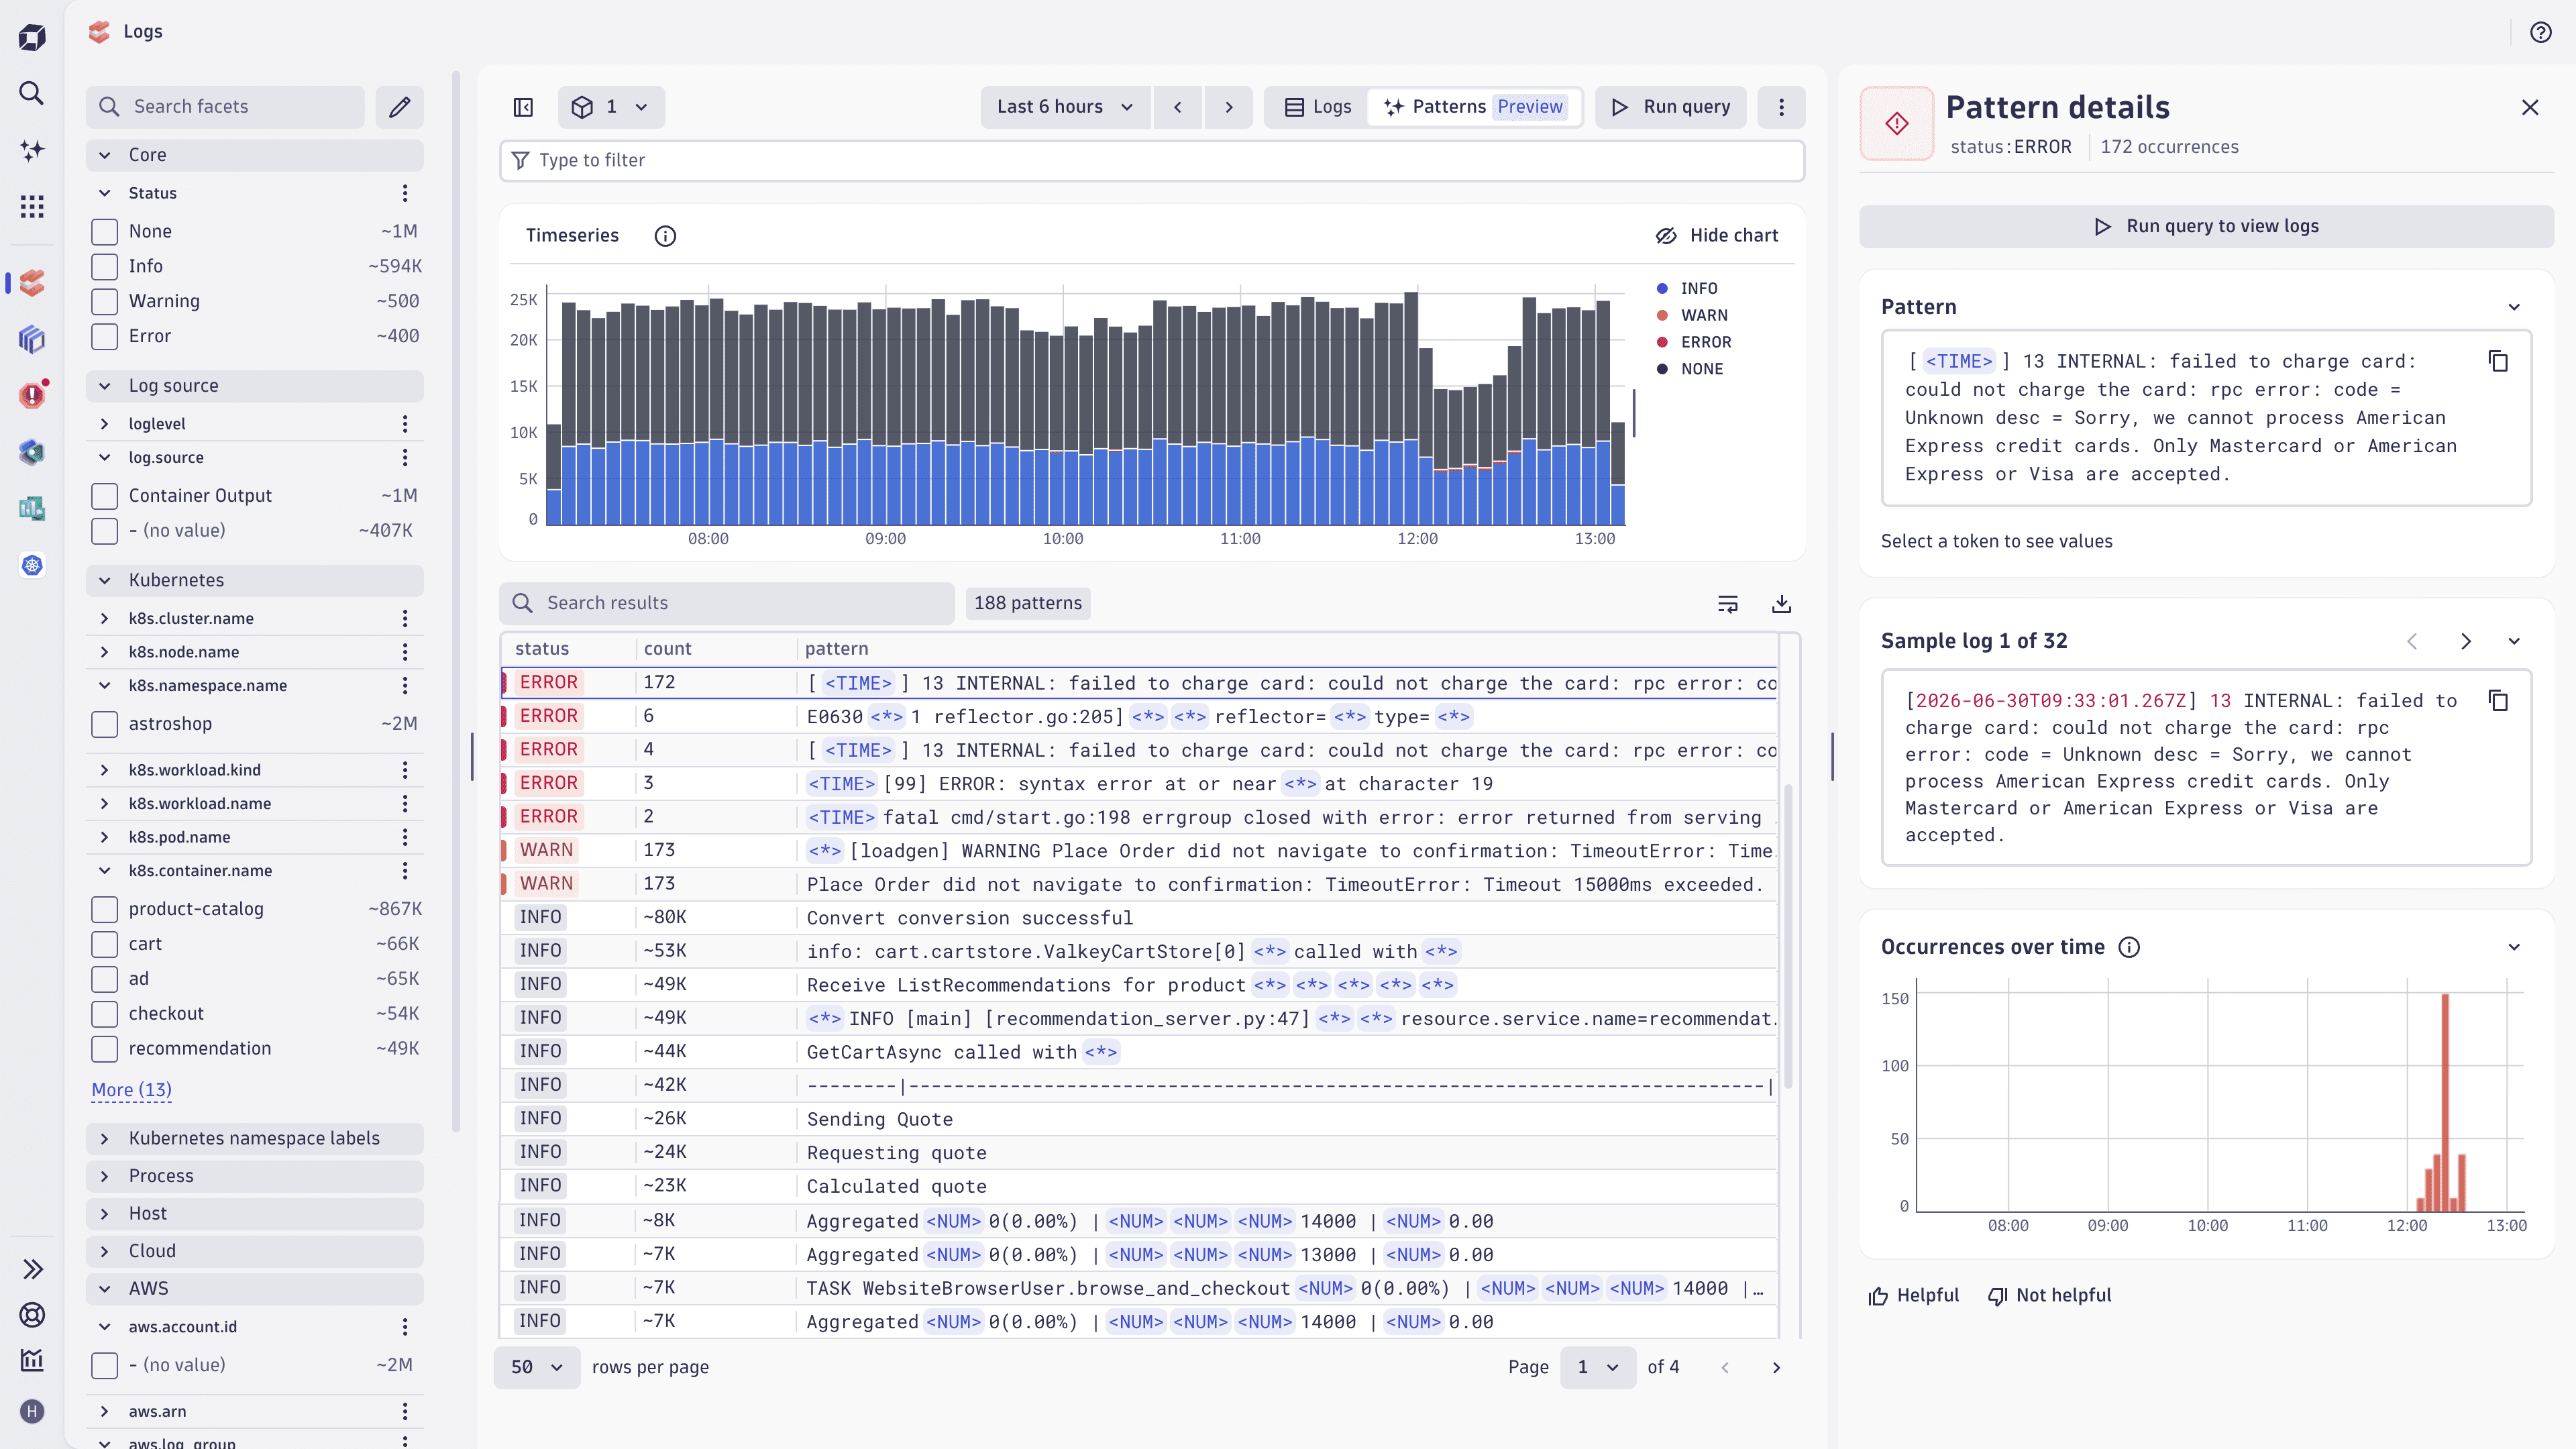
Log pattern analysis (Preview)
In  Logs, you can now aggregate your query results into patterns of data that show similar logs clustered together. This allows you to:
- Quickly focus on similar or recurring errors to troubleshoot faster
- Reduce thousands of similar logs to a handful of patterns to cut through the noise
- Recognize changing parts of the log pattern (token), including its datatype, to focus your next steps of analysis
- Reuse the generated DPL for the log pattern for other queries or in OpenPipeline
This is available as a preview.
Application Observability | Distributed Tracing
Distributed Tracing app: Improved visualization of errors and failures within Single Trace View
In  Distributed Tracing, we have improved the visualization of errors and failures within the Single Trace View.
Application Observability | Log Analytics
View trace details in context while investigating logs
When investigating a log entry with trace context in Logs, you can now open the associated trace details directly within Logs. A button with a waterfall icon—rather than the Distributed Tracing icon—signals that you stay in context rather than navigate away.
Application Observability | Open Telemetry
OpenTelemetry version update
We’ve updated opentelemetry-proto to version 1.10.0.
Digital Experience
New ready-made user action alert to monitor performance degradation
You can use a new, ready-made alert type to monitor user action performance degradation at the frontend level.
Digital Experience
New traffic and ANR alerts
We have added new traffic and ANR alerts for frontends.
Digital Experience
Select static, seasonal, or auto-adaptive analyzer on all alerts
You can now select between a static, seasonal, or auto-adaptive analyzer based on all alerts, and configure your own static threshold.
Digital Experience | Users & Sessions
New session definition
We have introduced significant improvements in session handling:
- Sessions with at least one user action or navigation are considered valid sessions and serialized.
- A session with a single user action or navigation is tagged as a bounce.
Infrastructure Observability | Clouds
Promotion for Databases in Clouds
If  Clouds detects a database in your cloud environment that isn’t monitored by
  Databases, Clouds now displays a banner recommending that you add database monitoring for that resource. Selecting the banner takes you directly to the setup flow so you can monitor the database with full Smartscape-based visibility and view it in Databases.
Infrastructure Observability | Databases
Database app: New Smartscape features require extension update
In Databases, to access the new features in the Explorer view, follow the on-screen messages for instructions on how to update the Databases extension and opt in to the new license as needed.
- Within the extension update, you get Smartscape entities for the vendors you upgraded the extension for, and access to the Smartscape-based explorer.
- On license opt-in, you get the new features specifically designed for Postgres and MySQL.
Infrastructure Observability | Extensions
Extensions with Unified Analysis pages for Smartscape
Extensions can now ship the Unified Analysis pages for Smartscape.
Infrastructure Observability | Hosts
New os_service.* property keys
New os_service.* property names for events and availability metrics are now available in addition to the old dt.osservice.* names. The existing .osservice.* names will be deprecated on Dynatrace SaaS in a future release.
Infrastructure Observability | Hosts
Host entity in Smartscape on Grail receives two new fields: sku and logical_cores
The host entities in Smartscape on Grail have two new fields: sku (for example, t3.small) and logical_cores (for example, 4).
For more information, see Smartscape – Core entities.
Infrastructure Observability | Hosts
Host entities from z/OS receive additional information in Smartscape on Grail
The following fields are added to host entities coming from z/OS:
zos.cpu_model_numberzos.cpu_serial_numberzos.system_namezos.virtualizationzos.total_general_purpose_processorszos.total_physical_memoryzos.total_ziip_processors
For details, see Global field reference.
Infrastructure Observability | Kubernetes
Container entities indicate containerization type used to run them
Container entities in Smartscape on Grail have a new field, container.containerization_type, indicating which containerization type is used to run the container (for example, cri-o).
For more information, see Smartscape – Core Entities.
Infrastructure Observability | Kubernetes
New security tab in the Kubernetes app
 Kubernetes version 1.42.0+ has a new security tab that replaces the Vulnerability tab in the Explorer. In Explorer (Classic), the Vulnerability tab remains.
Platform
Cloud and resource dimensions in OpenPipeline self-monitoring metrics
OpenPipeline self-monitoring (SFM) metrics now include cloud and resource dimensions, so you can break down ingested data by cloud provider and resource.
The SFM metrics are:
dt.sfm.openpipeline.ingest_sources_in.recordsdt.sfm.openpipeline.routing.recordsdt.sfm.openpipeline.pipelines_out.recordsdt.sfm.openpipeline.not_stored.records
The new dimensions are:
cloud.provideraws.regionazure.locationgcp.regionaws.resource.typeazure.resource.typegcp.asset.type
Platform
New self-monitoring metric measuring metric data points ingest
You can now track the number of ingested metric data points, broken down by metric key, metric source, cost allocation, and other dimensions. This is made available via the self-monitoring metric dt.sfm.metrics.ingest.datapoints.
Platform | Dashboards
Identify and manage active dashboards after migration
Editors and admins can now better identify, track, and manage relevant dashboards during and after the migration from Dashboards Classic. In the UI, editors gain additional metadata, such as last modified and last viewed, to more easily discover which dashboards are actively used or recently updated. In parallel, enhanced APIs expose key dashboard attributes.
To support the upgrade journey, we’ve introduced improved visibility into dashboard upgrade status and outcomes. You can now see which dashboards have been upgraded, their upgrade state (fully or partially upgraded), and details on upgrade failures. This information can be surfaced and queried (for example, via SFM and Markdown tiles), making it easier to troubleshoot issues, trace them back to their source in classic dashboards, and ensure a smoother transition once Dashboards Classic is hidden.
Platform | DQL
Extended meta information on data objects in Grail
The dt.system.data_objects fetch command now includes a new field usable_with field in its output
fetch dt.system.data_objects
The usable_with field contains an array of DQL commands for which the data object can be used.
Platform | OpenPipeline
Log data forwarding to Azure, GCP, and AWS storage
You can use OpenPipeline to select, transform, and store logs, spans, metrics, and events outside Dynatrace. Choose either AWS S3, GCP, or Azure Blob Storage as the destination.
The following event types are not yet supported for forwarding:
- events
- bizevents
- eventssecurity
- eventsSdlc
- davisEvents
- systemEvents
- securityEvents
This feature introduces a new capability on the rate card, Data Egress, whose consumption is measured in gibibytes (GiB) of data egressed.
Platform | Platform Services
Add up to 100 external requests allowlist entries
You can now add up to 100 entries to your external requests allowlist, double the previous limit of 50. This lets you connect even more integrations and add finer-grained patterns. Existing allowlist entries are preserved, and the new limit applies across all environments.
Platform | Platform Services
Schedule maintenance windows to separate planned changes from real incidents
You can now schedule maintenance windows in Dynatrace to mark planned deployments, upgrades, and load tests. One-time and recurring windows are supported. For recurring windows, you can use AutomationEngine scheduling rules and calendars to model complex patterns, such as business-hour exclusions or rolling release cycles.
During an active window, Dynatrace automatically enriches matching telemetry with maintenance metadata. Use it to filter dashboards, adjust workflow logic, and distinguish planned disruptions from real incidents. Windows are persisted as events in Grail, so you always have a complete maintenance history without needing to keep old configurations around.
Maintenance windows are available in Early Access. Problem suppression, synthetic disabling, and SLO time exclusions are planned for upcoming releases.
Platform | Segments
Improved navigation and sharing in Segments
The Segments app now opens in a new browser tab when accessed from the segment selector (for example, in  Dashboards or
  Notebooks), replacing the previous modal overlay. This lets you keep your current context while managing segments.
Additionally, segments in the management list are now rendered as standard links, enabling:
- Right-click > Open in new tab or Copy link address.
- Cmd/Ctrl+click to open in a new tab.
- Shareable, stable URLs for individual segments.
These changes align Segments with standard web navigation patterns, making it easier to share segment configurations with teammates and to work with multiple segments in parallel.
Platform | Workflows
Problem trigger in Workflows now fires on property updates and severity thresholds
In  Workflows, you can now configure a Problem trigger to fire when specific problem properties are updated or when severity meets or exceeds a defined threshold. Furthermore a Problem trigger allows to fire on problem open or close only, as well as on open and close.
Software Delivery
Metrics enriched with dt.openpipeline.source
Metrics ingested from extensions are now enriched with a new dt.openpipeline.source=extension:.
Threat Observability | Security events
CrowdStrike integration
You can now integrate Dynatrace with CrowdStrike to ingest detection findings.
Threat Observability | Security events
Unify Kubernetes policy compliance and observability: bring Kyverno findings into Dynatrace
When your DevOps team owns Kyverno and your SRE team owns Dynatrace, Kubernetes policy violations and runtime data live in separate silos. This integration streams Kyverno compliance findings directly into Dynatrace, so your SRE team can see policy violations in the context of affected workloads and services, all without leaving their platform or needing access to Kyverno. For setup and configuration details, see the Kyverno integration documentation.
Threat Observability | Security events
Unify open source security and observability: bring Black Duck findings into Dynatrace
When your development team owns Black Duck and your SRE team owns Dynatrace, open source vulnerability findings and runtime data live in separate silos. This integration streams Black Duck SCA vulnerability findings and scan events directly into Dynatrace, closing the DevSecOps loop between SDLC scanning and production observability, so your SRE team can see which open source risks actually affect running workloads, all without leaving their platform or needing access to Black Duck. For setup and configuration details, see the Black Duck integration documentation.
Threat Observability | Security events
Checkmarx integration
Dynatrace now integrates with Checkmarx.
Threat Observability | Security events
Unify artifact security and observability: bring JFrog Xray findings into Dynatrace
When your development team owns JFrog Xray and your SRE team owns Dynatrace, artifact vulnerabilities and runtime data live in separate silos. This integration streams JFrog Xray vulnerability findings, scan events, and audit logs directly into Dynatrace, so your SRE team gets supply chain security context without leaving their platform or needing access to JFrog. For setup and configuration details, see the JFrog integration documentation.
Threat Observability | Security events
Unify cloud security and observability: bring Wiz findings into Dynatrace
When your security team owns Wiz and your observability team owns Dynatrace, cloud misconfigurations and runtime data live in separate silos. This integration streams Wiz compliance findings and audit logs directly into Dynatrace, so your operations team gets security context without leaving their platform or needing access to Wiz. For setup and configuration details, see the Wiz integration documentation.
Breaking changes
Account Management
Endpoint deprecation
The following endpoints are deprecated as of June 15, 2026, and will sunset on January 11, 2027:
- For
GET /sub/v2/accounts/AccountUuid/subscriptions/SubscriptionUuid/environments/cost, the alternative isGET /sub/v3/accounts/AccountUuid/subscriptions/SubscriptionUuid/environments/cost. - For
GET /sub/v2/accounts/AccountUuid/subscriptions/SubscriptionUuid/environments/usage, the alternative isGET /sub/v3/accounts/AccountUuid/subscriptions/SubscriptionUuid/environments/usage. - For
POST /v1/accounts/AccountUuid/notifications, the alternative isGET /v2/accounts/{accountUuid}/notifications. - The
POST /iam/v1/repo/{levelType}/{levelId}/policies/validationendpoint is unavailable globally. Validation has moved to the create and update policy endpoints. - The
POST /iam/v1/repo/{levelType}/{levelId}/policies/validation/{policyUuid}endpoint is unavailable at the global level. Validation moved to create/update policy endpoints.
To replace the following deprecated endpoints, consider migrating your role-based permissions to IAM policies before the sunset date listed above. For more information, see Learn how to manage policies.
GET /iam/v1/accounts/{accountUuid}/{groupUuid}/permissionsPOST /iam/v1/accounts/{accountUuid}/{groupUuid}/permissionsPUT /iam/v1/accounts/{accountUuid}/{groupUuid}/permissionsDELETE /iam/v1/accounts/{accountUuid}/{groupUuid}/permissions
Application Observability
OneAgent end-of-life version connection enforcement
Starting with this release, Dynatrace rejects connections from OneAgent versions 1.141 and earlier.
If you’re running OneAgent version 1.141 or earlier, upgrade to a supported OneAgent version to avoid data loss and connectivity issues, and to benefit from enhanced security and features unavailable in earlier OneAgent versions.
For details, see End-of-life announcements.
Application Observability
External service metrics restricted to approved resource attribute dimensions
External service request metrics no longer include dimensions derived from resource attributes, except for the following four approved attributes: dt.security_context, dt.cost.product, dt.cost.costcenter, dt.system.monitoring_source. Previously, these metrics included additional dimensions that were incorrectly derived based on the calling service. As a result, they returned misleading data. If you filtered on removed dimensions in Dashboards or Notebooks, you can recover the same information by joining the calling service’s dimensions onto external service metrics using DQL.
Application Security
Stricter timestamp validation for security.events
Ingested security.events need to have a timestamp within a range of -1h/+10mins. Security.events with an older timestamp are dropped. Security.events with a new timestamp are set to +10mins. Previously, the accepted timerange was -24h/+10mins. It is still possible to omit the timestamp and let OpenPipeline automatically set it to the current one.
Application Security
AbuseIPDB and VirusTotal apps are deprecated — migrate to Security Enrichment
The standalone AbuseIPDB and VirusTotal enrichment apps are deprecated and will be removed in June 2026. Their replacement is  Security Enrichment, which provides all the same enrichment capabilities through vendor blueprint connections, along with response mapping, connection sharing, and workflow integration.
What will change: After the grace period ends in June 2026, the native AbuseIPDB and VirusTotal apps will be removed, and existing native connections will stop working. In-app deprecation banners guide you through the migration.
Action plan: Migrate each connection to Security Enrichment using the vendor blueprint:
- Go to Security Enrichment and select New connection.
- Choose the AbuseIPDB or VirusTotal blueprint.
- Enter your API key and optionally configure sharing.
- Select Test connection with a sample IP to verify the configuration.
- Save the connection.
- Remove the old native connection from the deprecated app.
Migration takes approximately 2 minutes per connection. For more information, see Migrate to Security Enrichment.
Infrastructure Observability
Network device extensions recommended feature sets and minimal default feature set
The new default feature set for network devices includes only interface status and control plane metrics. The interface traffic, discards, and errors metrics are now available under Interfaces and are no longer part of the default feature set. Metrics in the default feature set can’t be unselected directly. However, interface filters can be set to remove the entire interface collection.
The recommended label is assigned to a few feature sets that provide enhanced observability on top of the default feature set. The metrics part of these recommended feature sets is selected by default and can be unselected. For more information, see Best practices for optimizing network monitoring cost.
Platform | Dashboards
Stricter validation for dashboards
Starting with Dynatrace version 1.344, Dynatrace will apply stricter validation rules to dashboards and won’t display dashboards that fail validation.
This will mainly affect dashboards created or modified via the API or external AI tools. Dashboards created and maintained using Dashboards can’t fail validation unless you modify them otherwise.
- If a dashboard fails validation before Dynatrace version 1.344, Dashboards will display a warning and a failure reason, but the dashboard will continue to load as usual.
- Starting with Dynatrace version 1.344, a dashboard that fails validation won’t load until you fix it.
Platform | Dashboards
Hidden single-select and multi-select variables no longer support default values
Hidden multi-select variables now always resolve to * (all options), and hidden single-select variables resolve to the first available value from the query results. This removes inconsistent behavior in which hidden variables that depend on visible variables can produce unpredictable values. If you previously relied on a static default value for a hidden select variable, use a text variable instead.